
Everything a quick-commerce brand needs to see.
Real screens from the dashboard, with sample data.
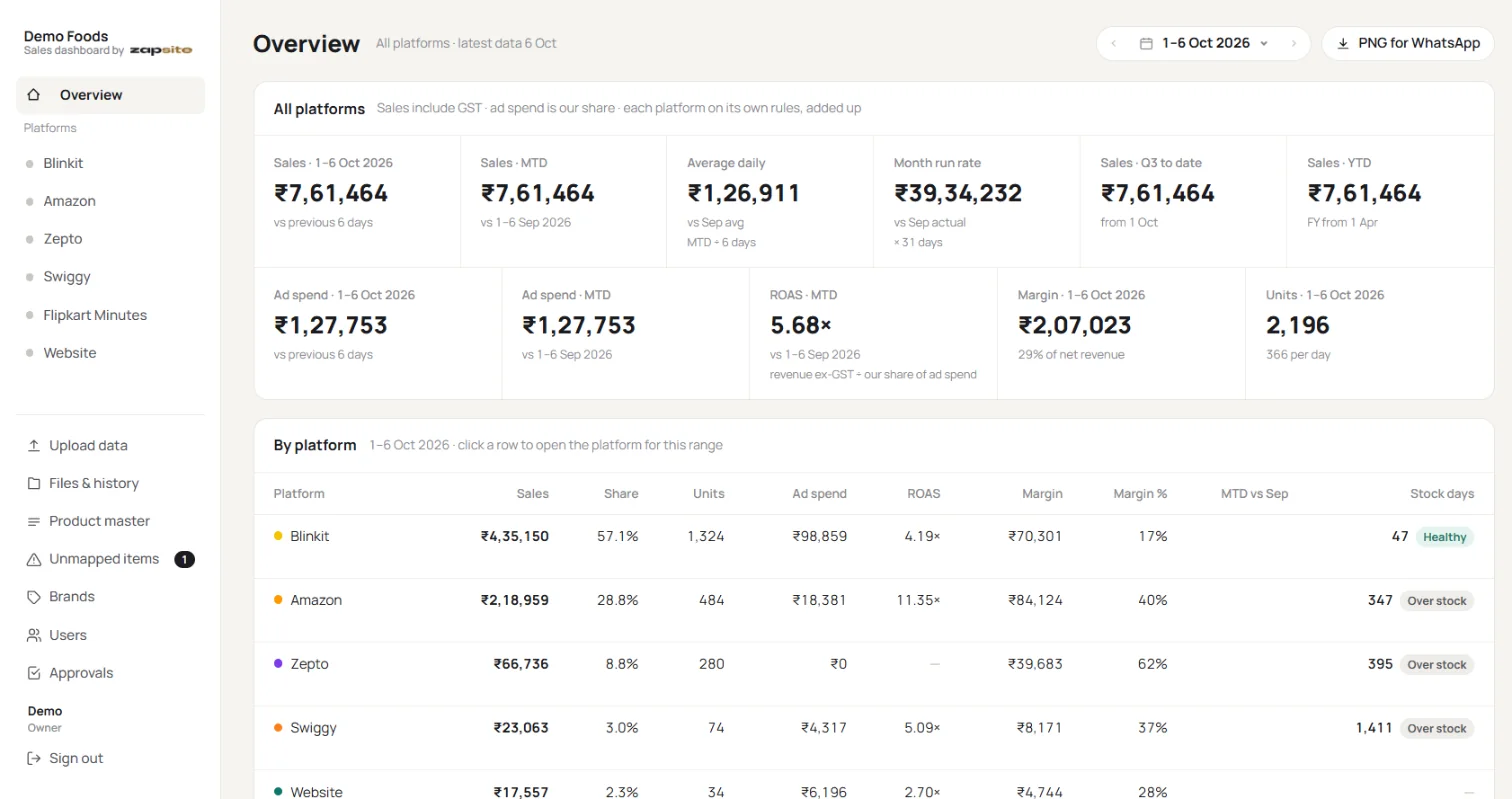
All platforms on one screen.
The Overview adds up every platform so you see the whole business at a glance, for any date range.
- Sales, ad spend, ROAS, margin and units
- Month to date, run rate, quarter and year to date
- Compared with the period before
- One-click PNG to share on WhatsApp
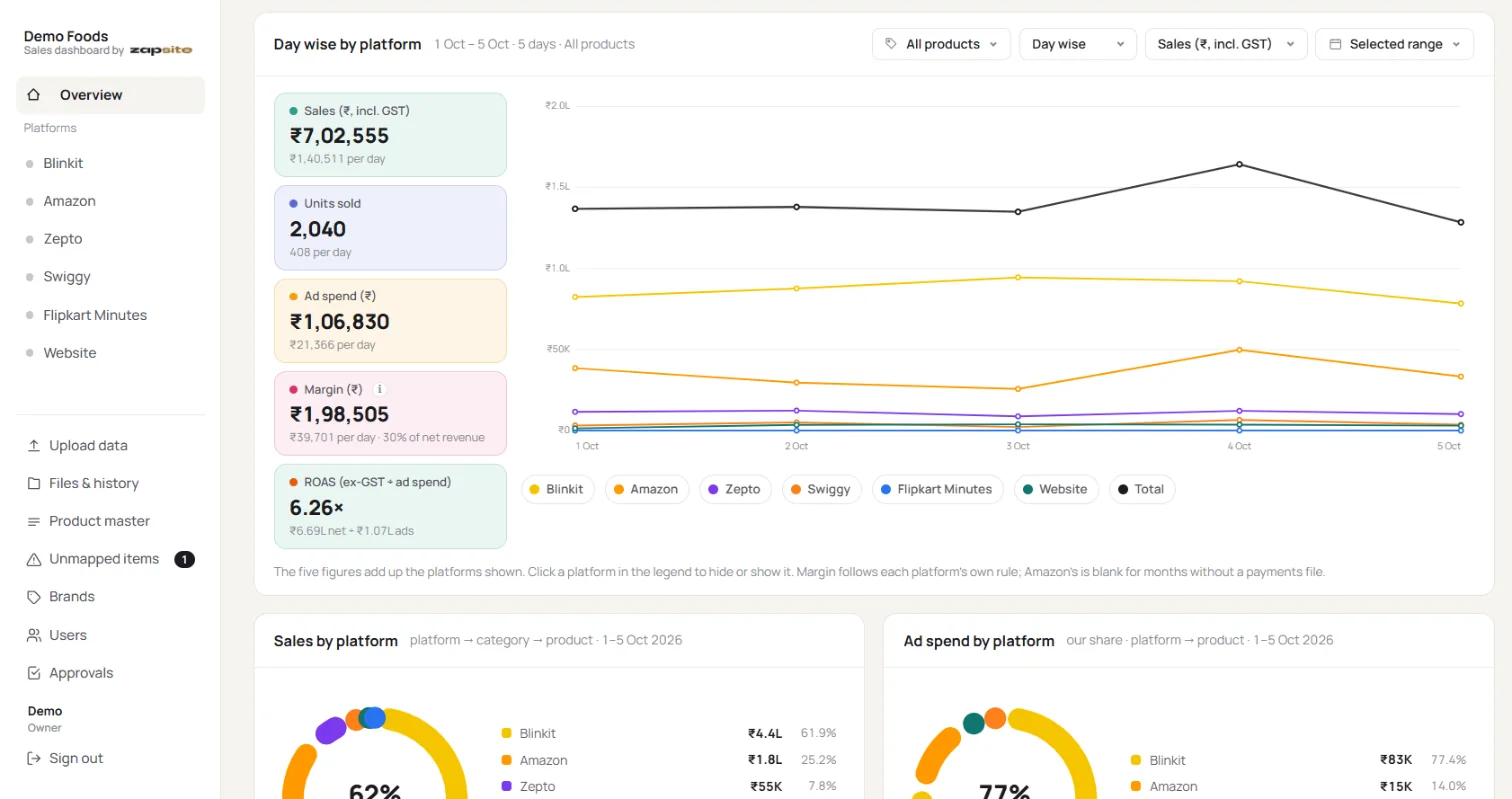
See the trend, not just the total.
Day-wise charts per platform for sales, units, ad spend and margin. Switch to weekly or monthly, or pick one product.
- Day, week or month view
- Filter to a single product
- Hide or show platforms in one click
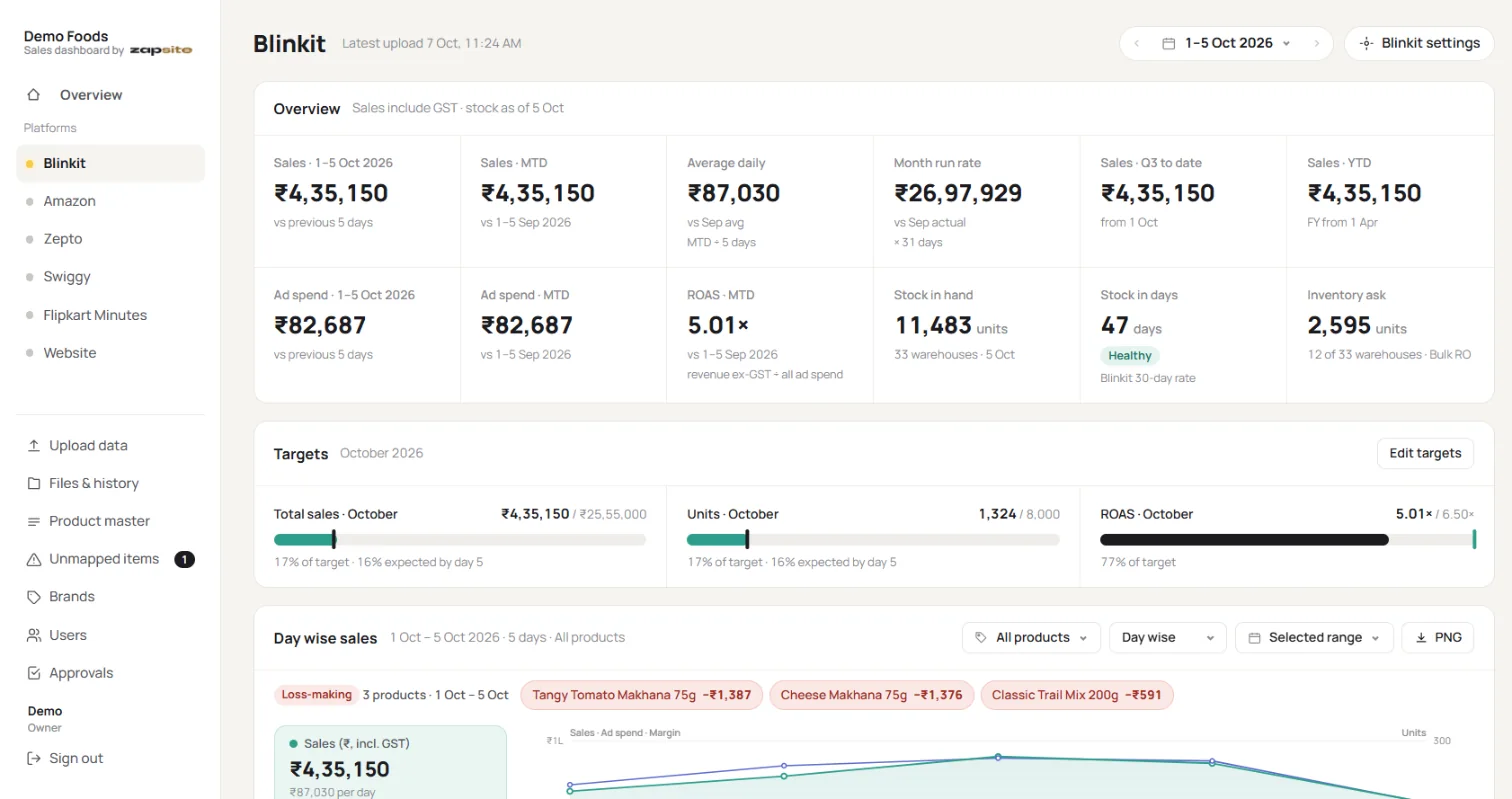
A full page for each platform.
Blinkit, Zepto, Instamart, Amazon, Flipkart Minutes and your website each get their own page with the numbers that matter there.
- Monthly targets for sales, units and ROAS
- Stock in hand, days of cover and inventory ask
- Loss-making products flagged at the top
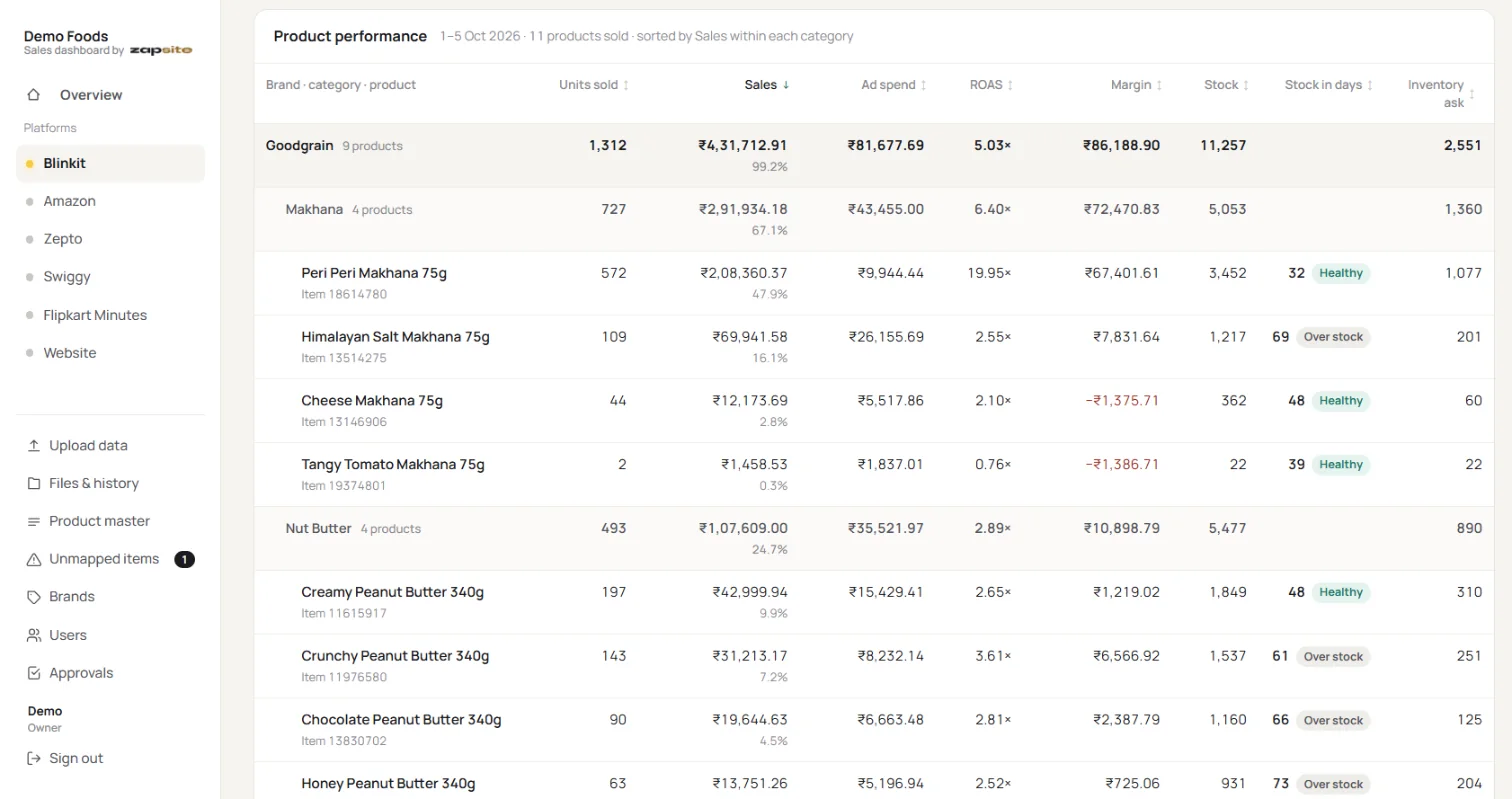
Product margin, done properly.
Margin for every product after GST, commission, its own ad spend and its cost. Costs are saved with each upload, so changing a cost never rewrites the past.
- Grouped by brand and category
- Sort by sales, ROAS, margin or stock
- Losses shown in red
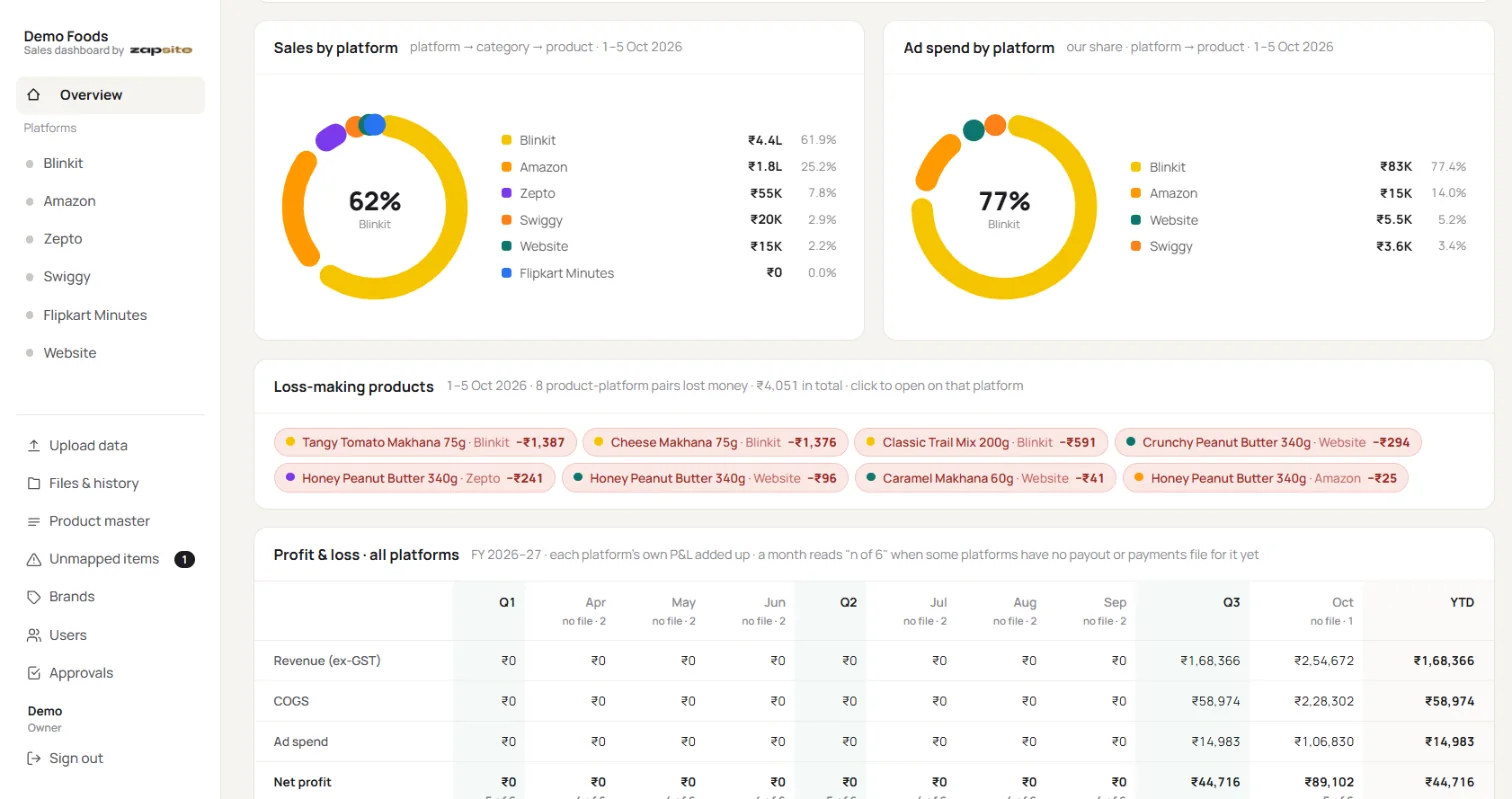
Know where the money comes from.
See each platform's share of sales and ad spend, and the list of product and platform pairs that lost money.
- Sales and ad spend split by platform
- Drill down from platform to category to product
- Loss-making products, one click away
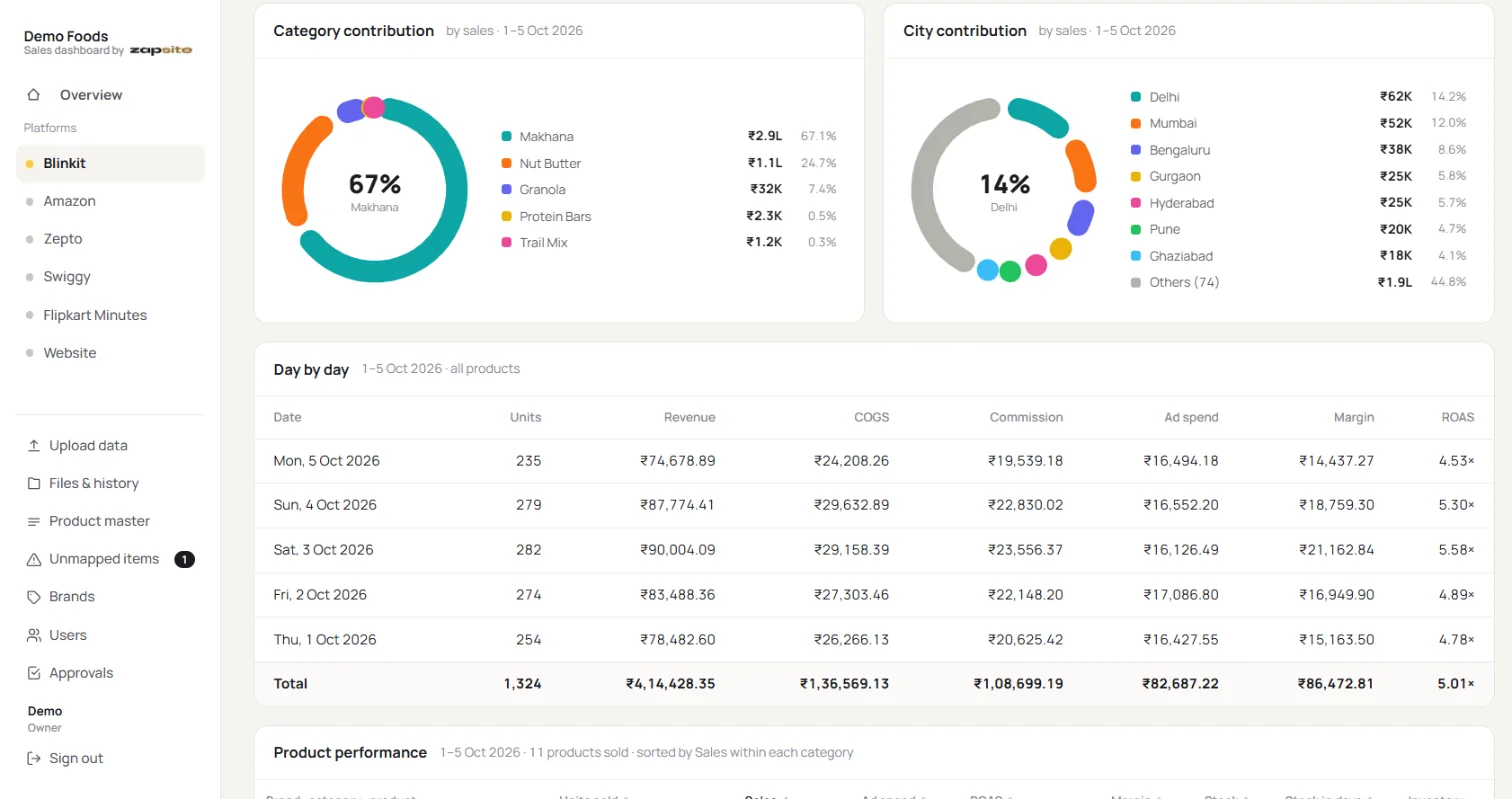
Which categories and cities sell.
Category and city contribution, plus a day-by-day table of units, revenue, COGS, commission, ad spend and margin.
- City-wise sales
- Category share
- Daily profit table you can trust
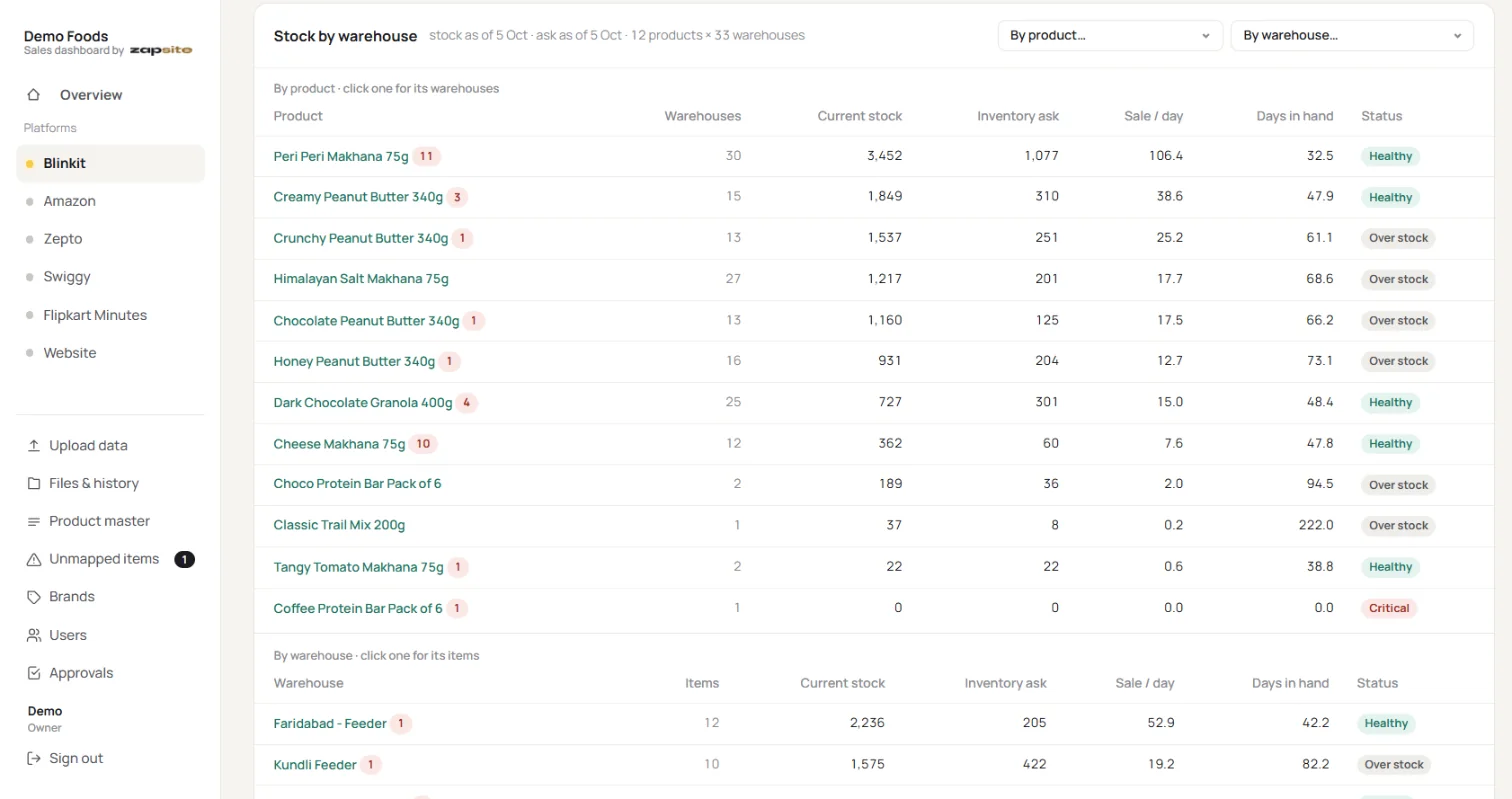
Stock before it runs out.
Current stock by product and by warehouse, daily sale rate and days in hand, with a status for each.
- Healthy, over stock and critical at a glance
- By product or by warehouse
- Inventory ask from platform files
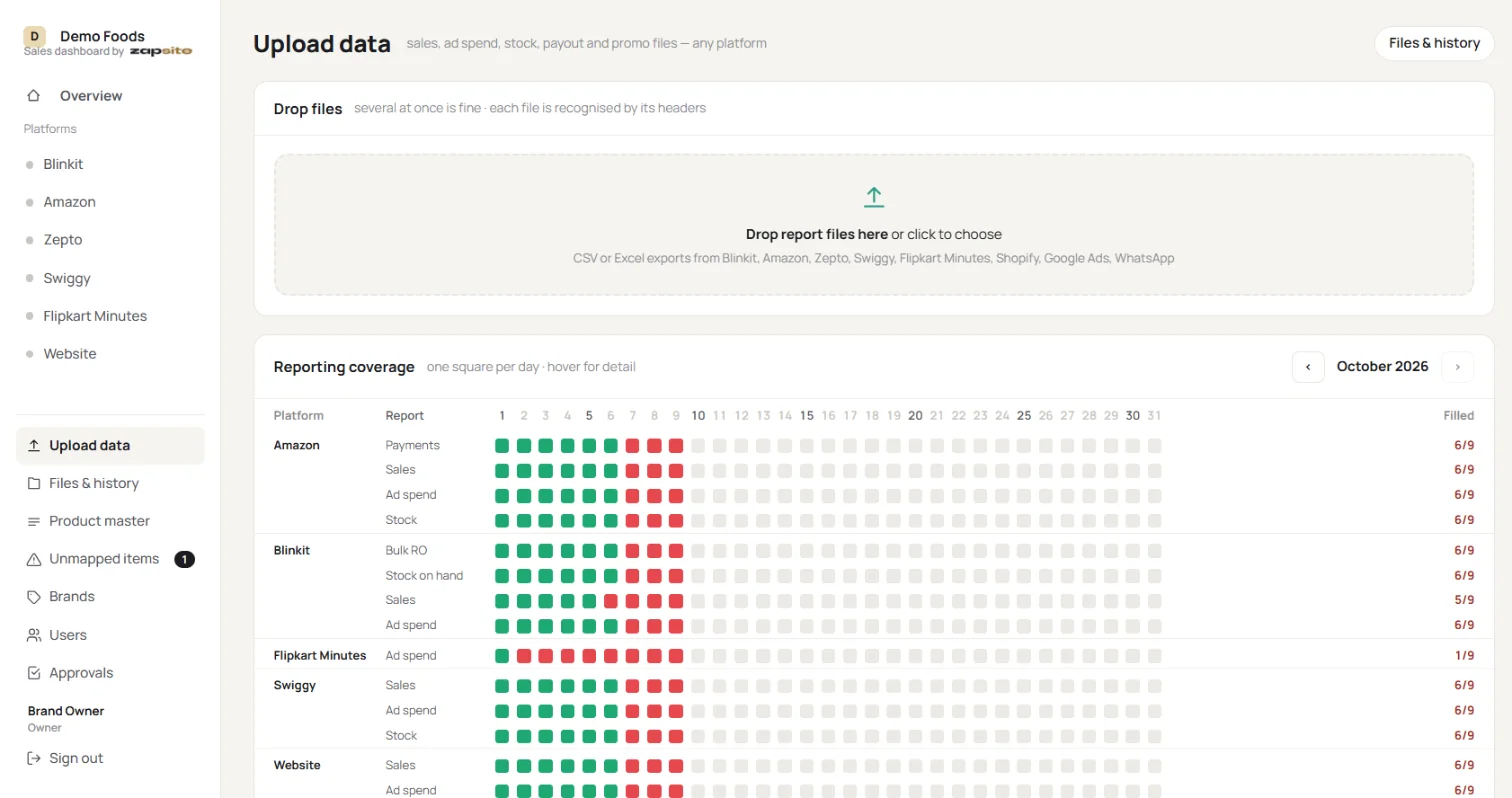
Uploading takes a minute.
Drag in any report: sales, ads, stock, payouts or promos. The dashboard works out which platform and report it is.
- Several files at once
- Calendar of uploaded and missing days
- Re-uploading a day never double counts
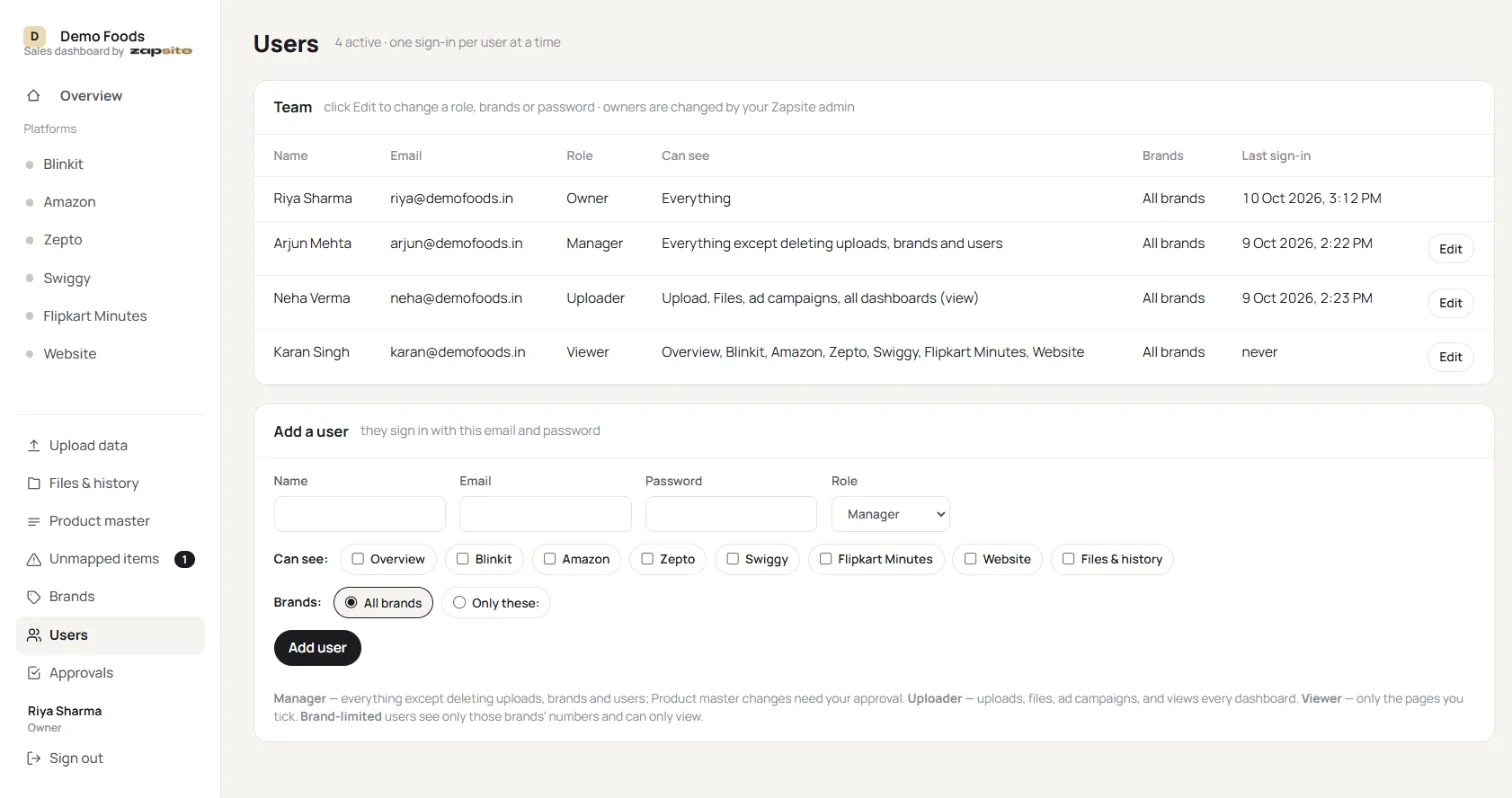
Your team, with the right access.
Give each person exactly what they need. Changes to product costs by a manager wait for the owner's approval.
- Owner, manager, uploader and viewer roles
- Limit someone to one brand
- One sign-in per person, with a full activity log
Built to keep your data safe.
Separate database per company
Your numbers are never mixed with another brand's.
One sign-in per person
Signing in on a new device signs out the old one.
Activity log
See who uploaded, deleted or changed what, and when.
Backups
Full backups of every company's data.
Encrypted connection
All traffic runs over HTTPS.
No seller passwords
We never log in to your platform accounts.
See it with your own numbers.
Book a 20-minute demo. Bring last week's reports and we'll show you your margin by product.